Stats - Click Log - Group by stat
Stats
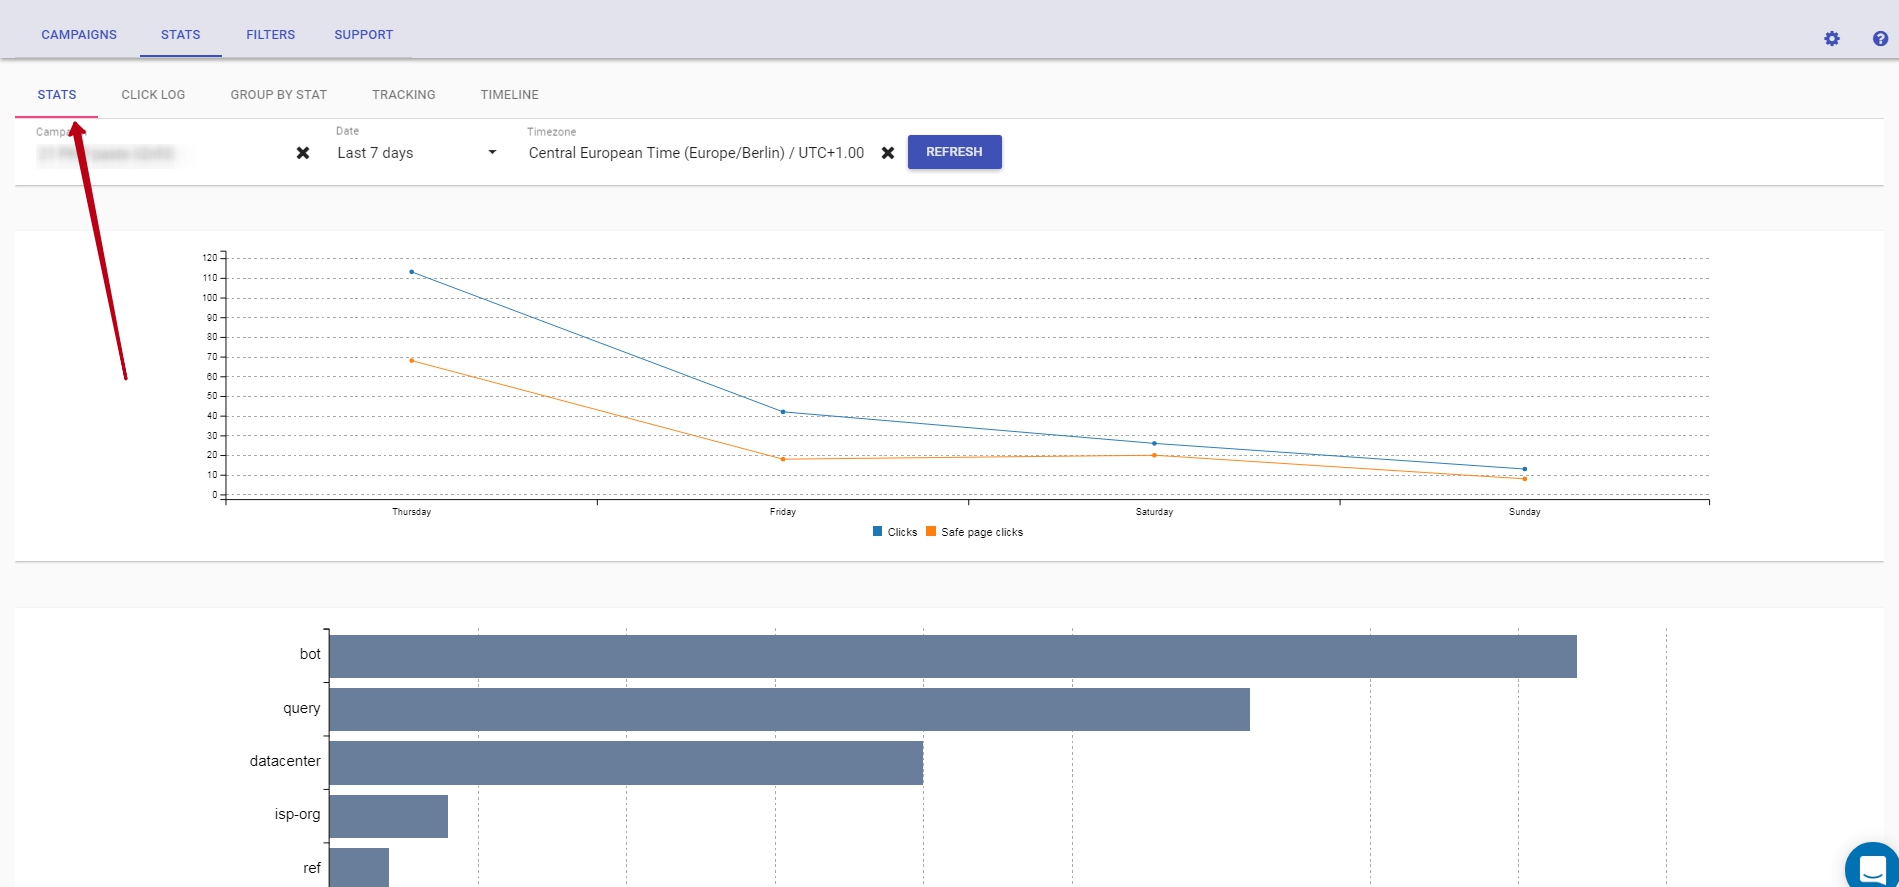
Using Stats you'll be able to evaluate accurately your campaigns through the number of visits, the safe page visit rate and the reasons your visitors are sent to the safe page.
You will see the stats of a specific campaign in Stats section:
- a graph with your campaign's activity throughout a specific time-frame
- a chart with all the reasons and percentage of your safe page clicks
You can obtain a detailed evaluation for a specific time-frame: Today, Last hour, Last 7 days, Last month etc, using the drop-down list.
Click log
Using click log you can view each click and where it's going.
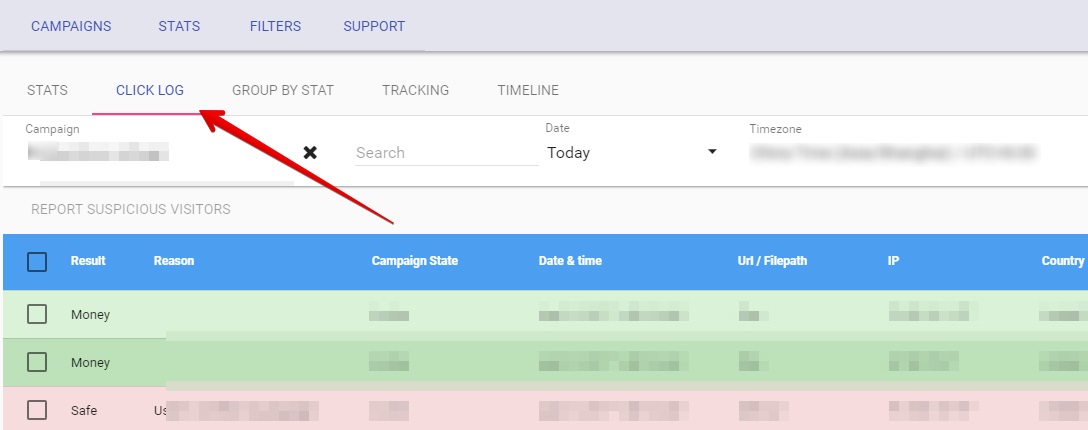
In Reason column you'll find the reasons the traffic is directed to the safe page or money page and adjust your filters and conditions based on these observations.
Various reasons are documented here: https://docs.fraudfilter.io/kb/filters/, you can also disable them if you want.
If you do not see the traffic in click log then it means you've not properly integrated the code or your server is not able to send requests to our API. In this case we recommend testing your setup with the help of this guide: https://docs.fraudfilter.io/kb/how-to-test-if-fraudfilter-is-working/
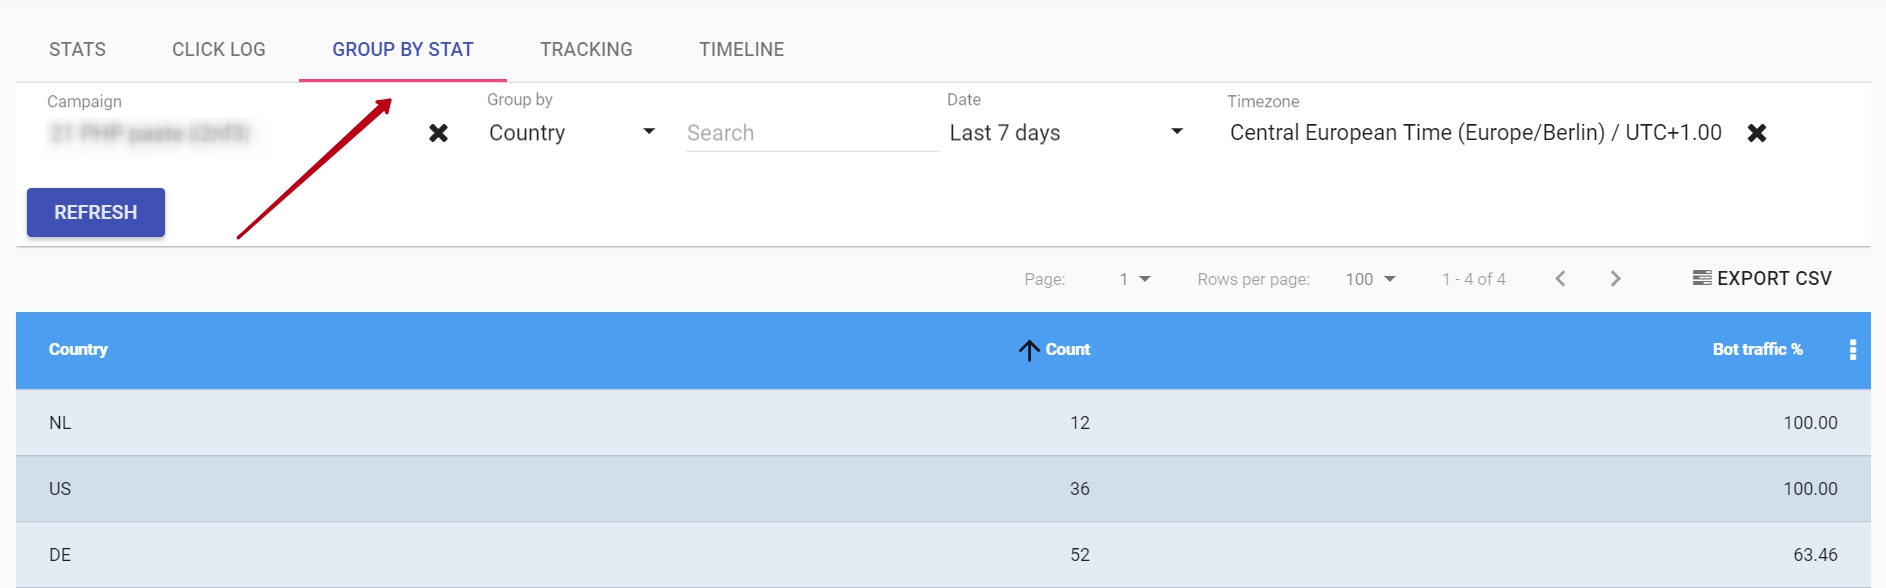
Group by stat
This feature will allow you to obtain detailed reports by Country, Organization, ISP, Carrier, Brand, Browser.